
Building an AI-Native IoT Platform: From $0 PoC to Production Scale
A deep dive into architecting a real-time HVAC monitoring platform - SmartAC case study

Introduction
Imagine building the infrastructure that turns millions of HVAC systems into intelligent, connected assets. This is the challenge facing SmartAC: creating an event-driven, AI-native platform that ingests real-time sensor data, runs ML models for predictive maintenance, and scales from prototype to millions of homes.
This article explores how to architect such a system, starting with a zero-cost local proof-of-concept on an M1 Mac, with a clear migration path to production-grade AWS infrastructure.
The Challenge
SmartAC needs a platform that can:
Ingest near-real-time telemetry from millions of smart thermostats and HVAC sensors
Run proprietary ML models for diagnostics and predictive maintenance
Support both small pilots and massive scale (1 device → 1M+ devices)
Start with $0 infrastructure cost before product-market fit
Enable rapid iteration during early development
Architecture Philosophy
The key insight: use the same architectural patterns in PoC and production, but swap out the implementation technologies. This means:
Event-driven architecture from day one
Microservices with clear boundaries
Time-series optimized storage
ML model serving infrastructure
Comprehensive observability
When you migrate from local to cloud, you’re changing where things run, not how they work.
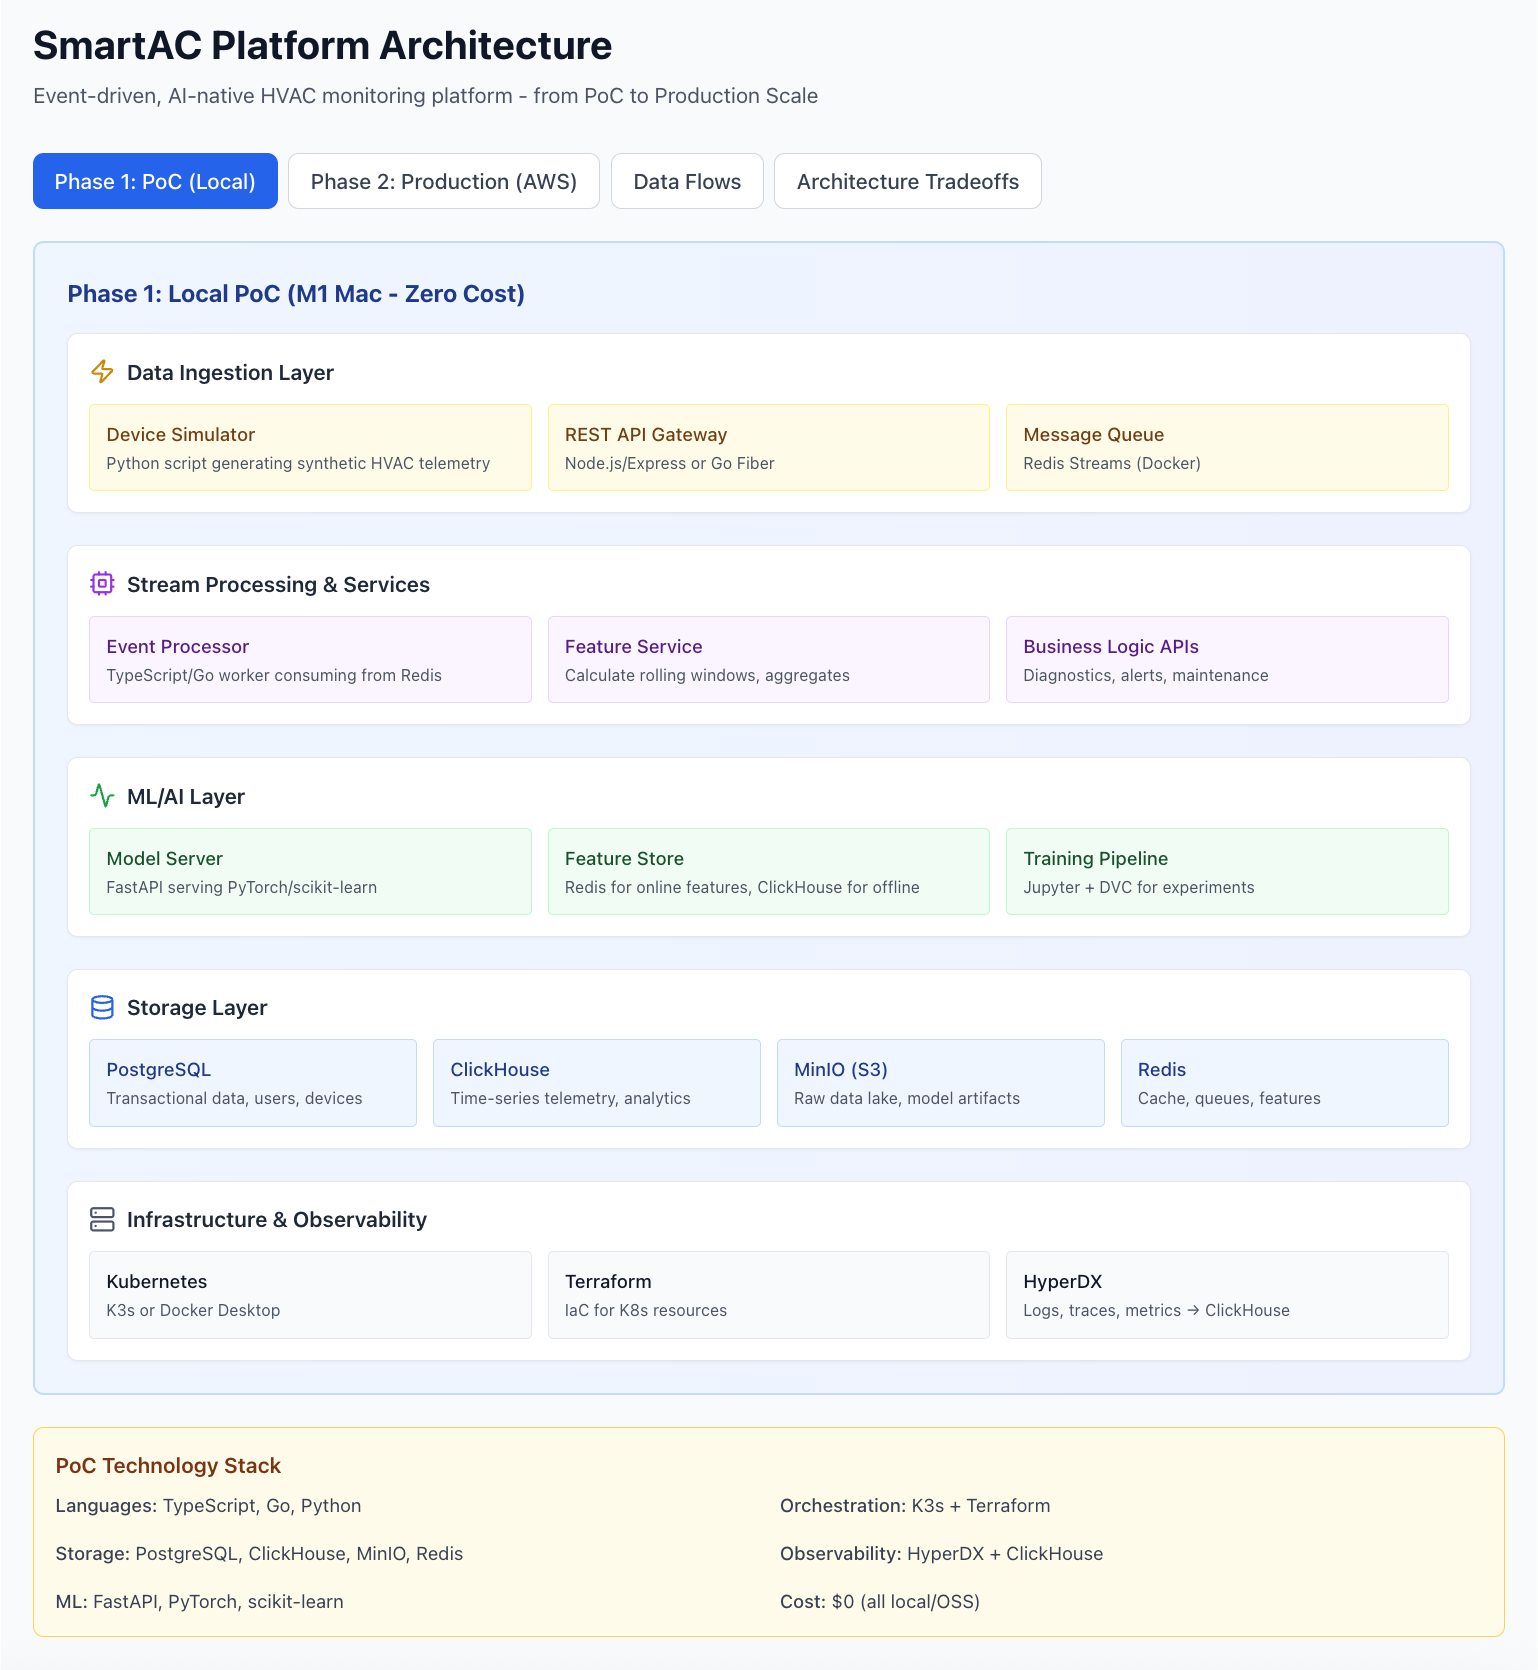
Phase 1: Local PoC Architecture ($0/month)
Core Components
1. Data Ingestion Layer
Components:
Device Simulator: Python script generating synthetic HVAC telemetry (temperature, humidity, duty cycle, etc.)
REST API Gateway: Node.js/Express or Go Fiber handling device connections
Message Queue: Redis Streams for event ingestion and distribution
Why these choices?
Redis Streams provides Kafka-like consumer groups without operational complexity
REST APIs are simple to implement and test
Can simulate 1,000+ devices on a laptop
Data flow:
Simulated Device → REST POST → API Gateway → Redis Stream → Event Processors2. Stream Processing & Services
Components:
Event Processor: TypeScript or Go workers consuming from Redis
Feature Engineering Service: Calculate rolling averages, trends, anomaly scores
Business Logic APIs: Diagnostics engine, alert service, maintenance scheduler
Key patterns:
Consumer groups for horizontal scalability (even locally)
Idempotent event processing
At-least-once delivery semantics
3. ML/AI Layer
Components:
Model Server: FastAPI serving PyTorch or scikit-learn models
Feature Store:
Online features: Redis (sub-10ms lookups)
Offline features: ClickHouse (batch training)
Training Pipeline: Jupyter notebooks + DVC for experiment tracking
Example model workflow:
python
# Real-time inference
features = redis.get(f”features:{device_id}”)  # Online features
prediction = model.predict(features)
confidence_score = prediction.confidence

if confidence_score > 0.85 and prediction.anomaly:
    trigger_alert(device_id, prediction.issue_type)
4. Storage Layer
Components:
PostgreSQL: Transactional data (users, devices, work orders, billing)
ClickHouse: Time-series telemetry and analytics
Handles billions of sensor readings
10:1 compression ratio
Sub-second analytical queries
MinIO: S3-compatible object storage for:
Raw event logs
ML model artifacts
Training datasets
Redis:
Hot cache for dashboard queries
Real-time feature serving
Message queue (Redis Streams)
Why ClickHouse over alternatives?
ClickHouse is purpose-built for analytical queries on time-series data:
100x faster than PostgreSQL for time-series aggregations
Native compression: 1TB of sensor data → 100GB on disk
Columnar storage: Perfect for “give me avg temperature for last 30 days” queries
Built-in functions: Percentiles, moving averages, time windows
Trade-off: Limited UPDATE/DELETE operations (append-only by design), eventual consistency.
5. Infrastructure & Observability
Components:
Kubernetes: K3s (lightweight K8s for local dev)
Infrastructure-as-Code: Terraform for all K8s resources
Observability: HyperDX (open-source Datadog alternative)
Logs, traces, metrics in one place
Uses ClickHouse as backend
Built-in dashboards and alerting
Local setup:
bash
# Start K3s cluster
k3d cluster create smartac-dev

# Deploy infrastructure with Terraform
terraform apply -var=”environment=local”

# Deploy application services
kubectl apply -f k8s/deployments/
Complete PoC Technology Stack
LayerTechnologyWhy?LanguagesTypeScript, Go, PythonType safety, performance, ML ecosystemOrchestrationK3s + TerraformFull K8s API, IaC from day 1Message QueueRedis StreamsSimple, fast, consumer groupsDatabasesPostgreSQL, ClickHouse, RedisOLTP, OLAP, cachingObject StorageMinIOS3-compatible, localML StackFastAPI, PyTorch, scikit-learnFlexible, production-readyObservabilityHyperDX + ClickHouseFull-stack visibilityCost$0/monthAll open-source, runs locallyData Flow Patterns
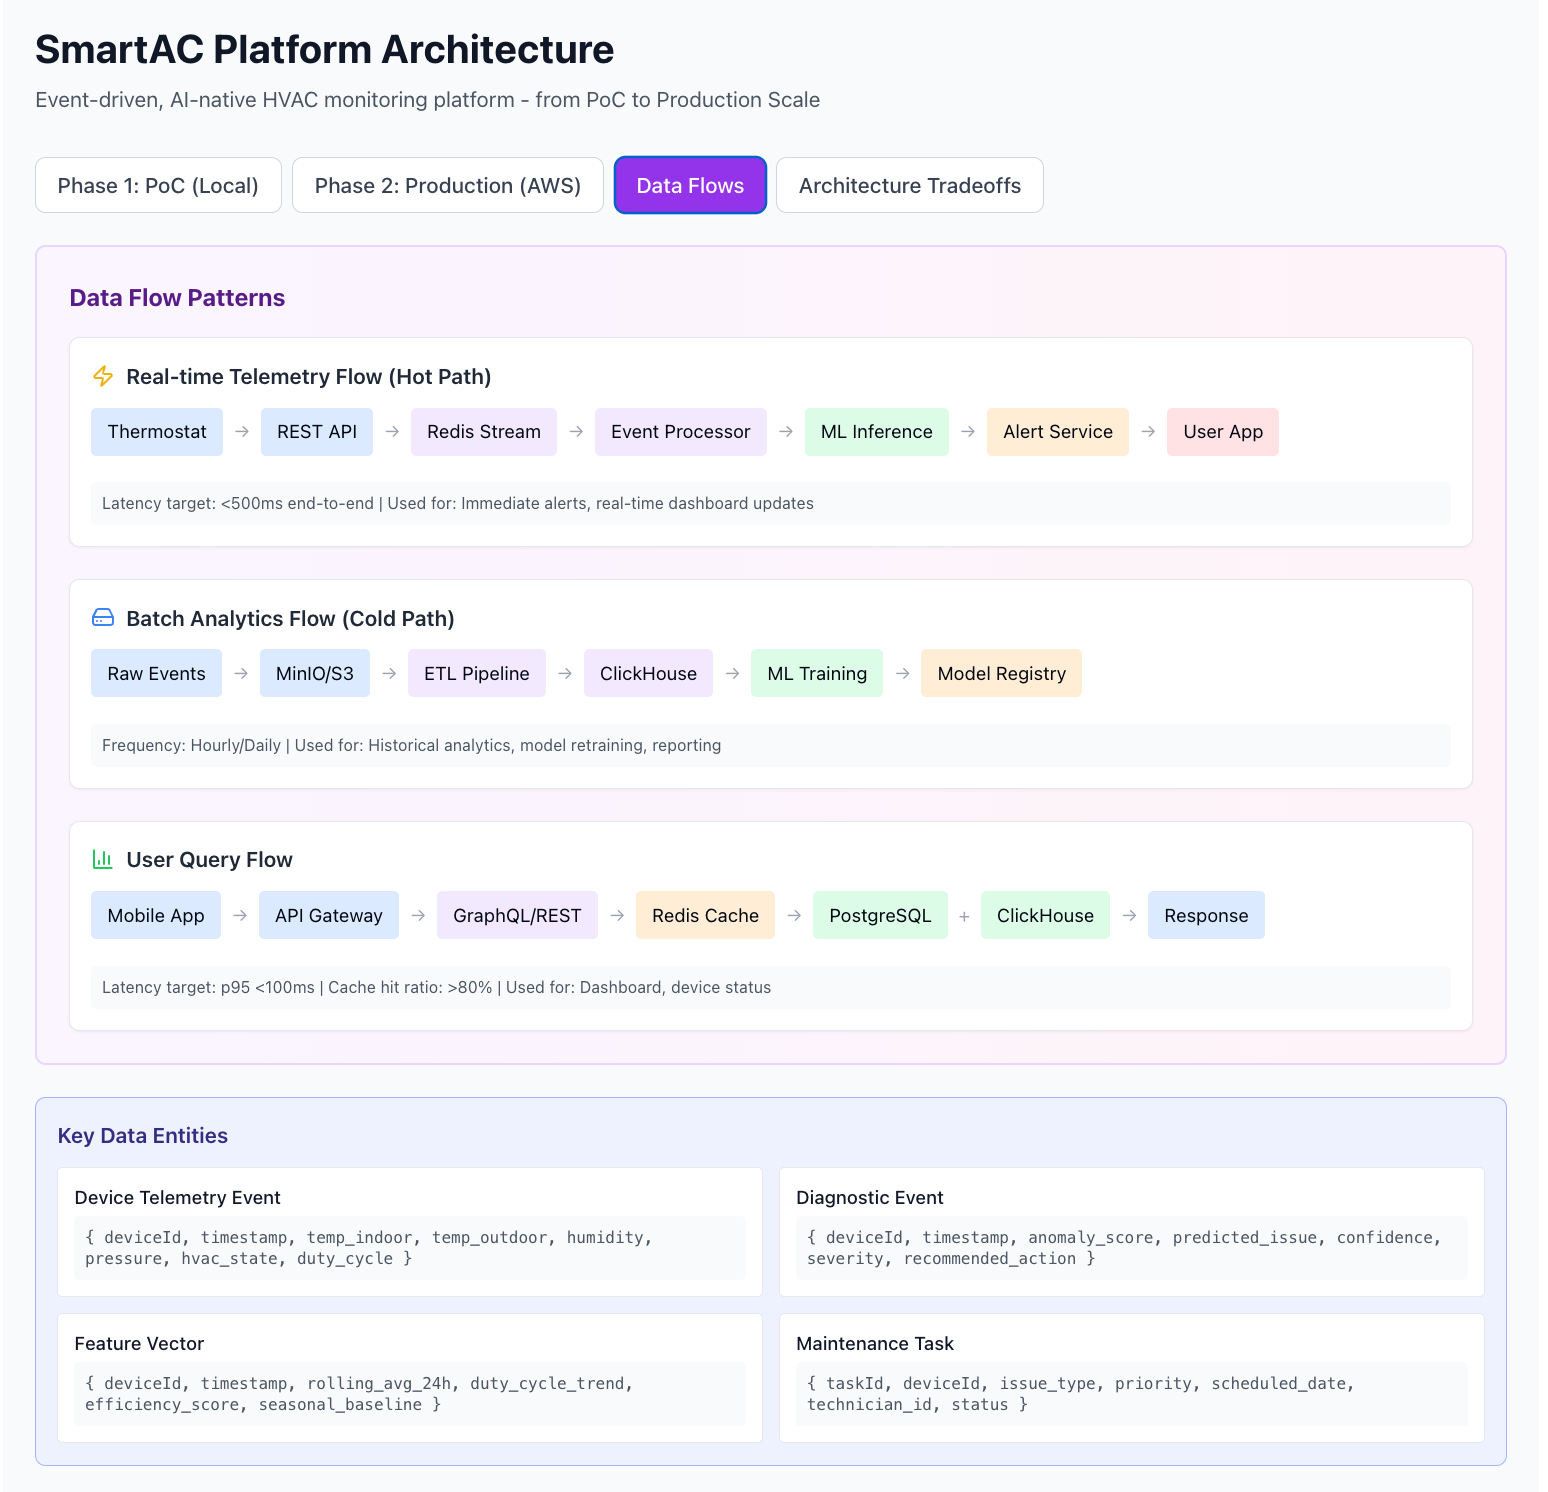
1. Real-Time Telemetry Flow (Hot Path)
Latency target: <500ms end-to-end
Smart Thermostat
  → REST API (POST /telemetry)
  → Redis Stream (XADD events)
  → Event Processor (XREADGROUP)
  → ML Inference Service (FastAPI)
  → Alert Service (if anomaly detected)
  → Push Notification (FCM/APNs)
  → User Mobile App
Use cases:
Immediate alerts for HVAC failures
Real-time dashboard updates
Instant diagnostics
Example event:
json
{
  “deviceId”: “thermostat_abc123”,
  “timestamp”: “2024-12-04T10:30:00Z”,
  “measurements”: {
    “tempIndoor”: 72.5,
    “tempOutdoor”: 85.2,
    “humidity”: 45,
    “hvacState”: “cooling”,
    “dutyCycle”: 0.65
  }
}
2. Batch Analytics Flow (Cold Path)
Frequency: Hourly/Daily
Raw Events (Redis)
  → Batch Export to MinIO/S3
  → ETL Pipeline (Python/dbt)
  → ClickHouse (materialized views)
  → ML Training (batch features)
  → Model Registry (MLflow)
  → Deploy New Model
Use cases:
Historical trend analysis
Model retraining with new data
Business intelligence reports
Energy efficiency scoring
3. User Query Flow
Latency target: p95 <100ms
Mobile App
  → API Gateway (Auth check)
  → REST/GraphQL API
  → Redis Cache (check)
    ├─ Cache HIT → Return immediately
    └─ Cache MISS → Query databases
       ├─ PostgreSQL (device metadata)
       └─ ClickHouse (time-series data)
  → Update Redis Cache
  → Return Response
Cache strategy:
Dashboard data: 30s TTL
Device status: 5s TTL
Historical reports: 5min TTL
Target cache hit ratio: >80%
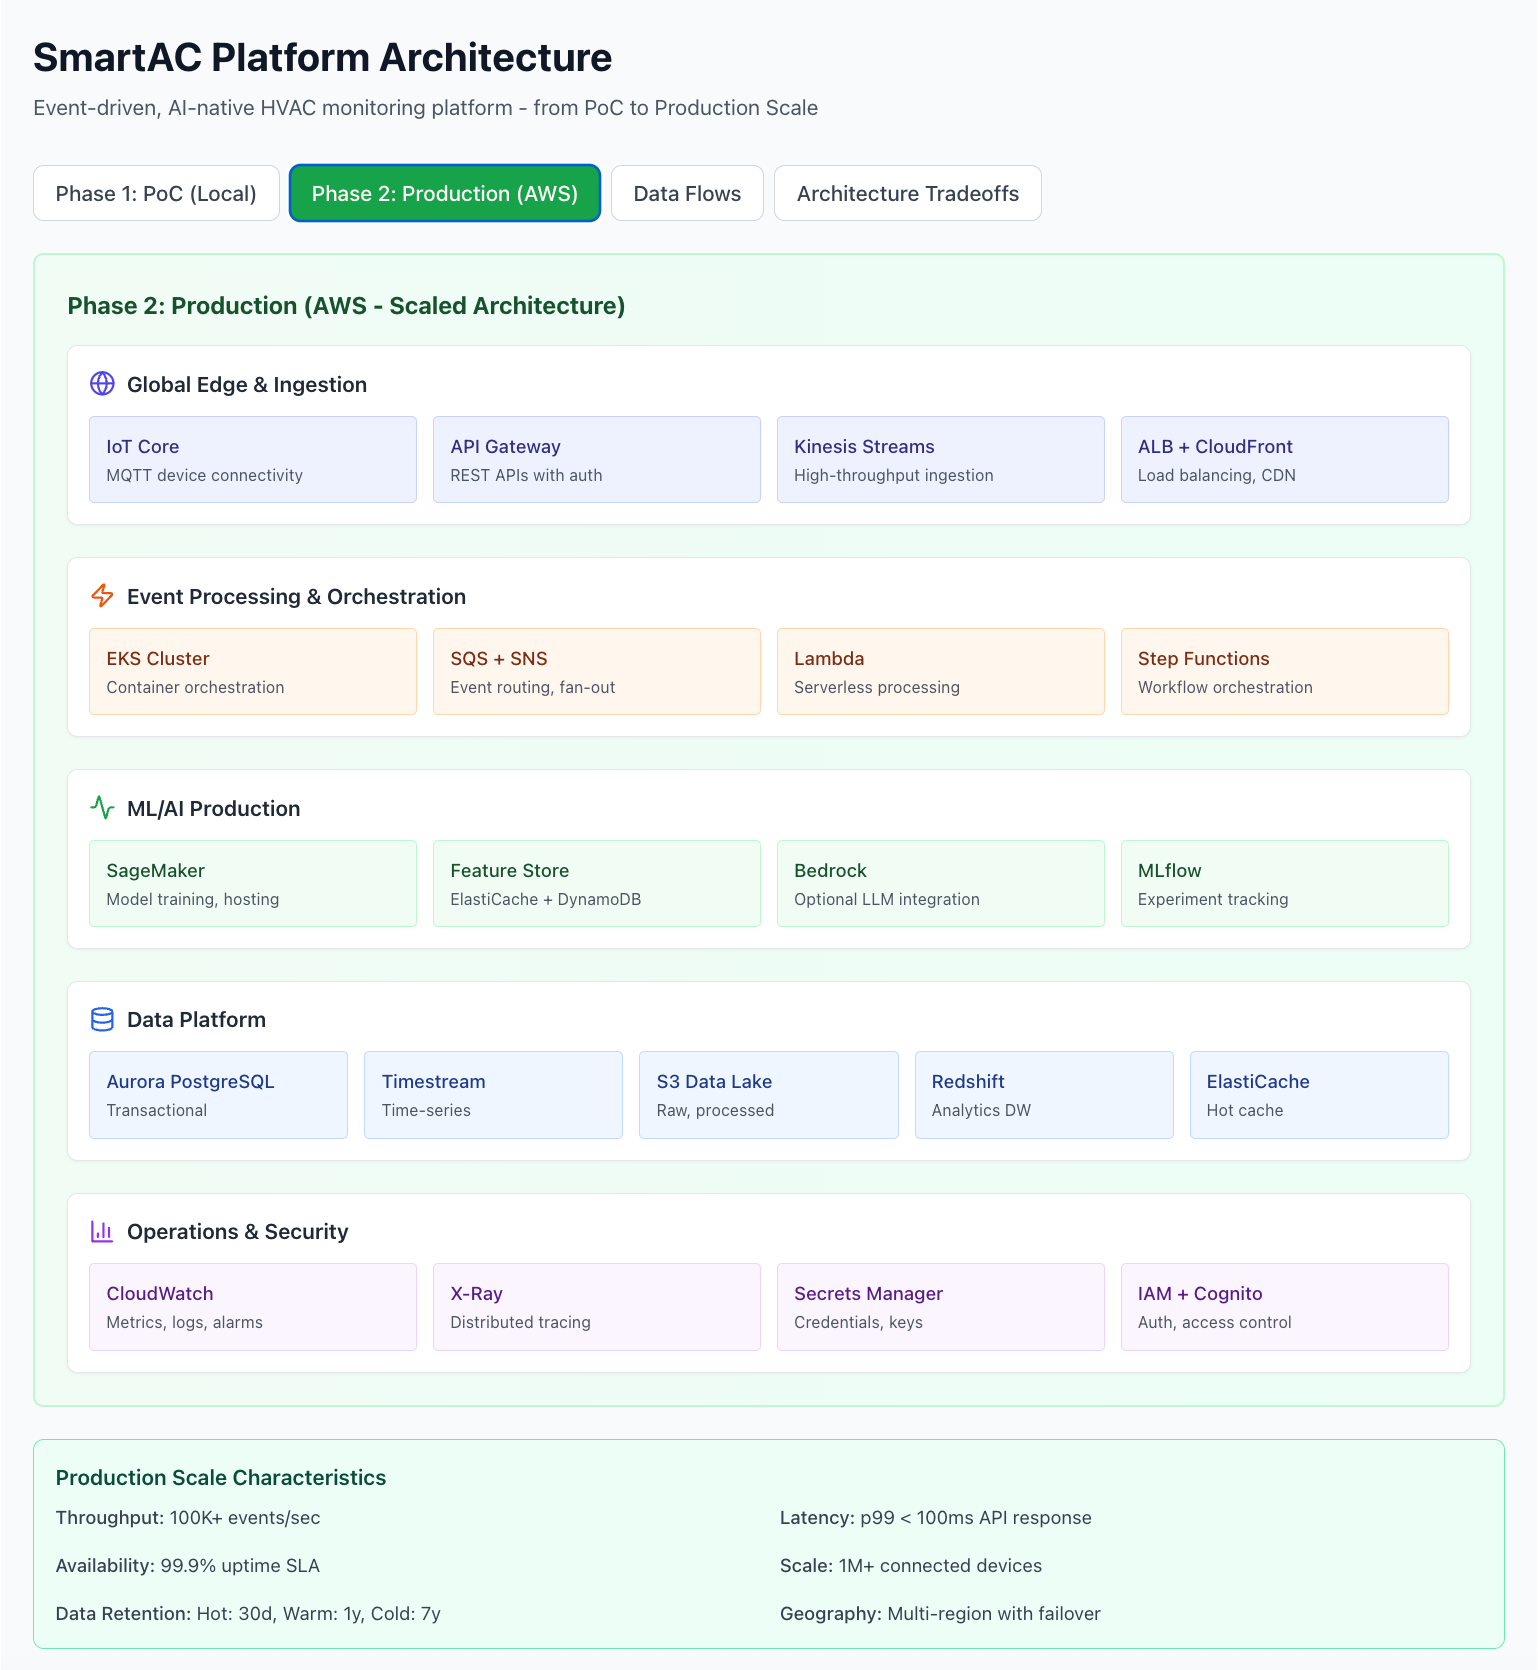
Phase 2: Production Architecture (AWS)
Migration Strategy
The beauty of the PoC architecture is that every component has a direct cloud equivalent:
PoC (Local)Production (AWS)Migration ComplexityK3sEKS (Elastic Kubernetes)Low - same K8s APIsRedis StreamsKinesis Data StreamsMedium - API changesPostgreSQLAurora PostgreSQLLow - connection stringClickHouseTimestream or self-hostedMedium - query syntax similarMinIOS3Low - S3-compatible APIFastAPI containersSageMaker or EKSLow - containerized alreadyHyperDXCloudWatch + X-RayMedium - different APIsProduction Components
Ingestion & Edge
AWS IoT Core: MQTT device connectivity at scale
API Gateway: Managed REST APIs with auth (Cognito)
Kinesis Data Streams: High-throughput event ingestion (millions/sec)
Application Load Balancer + CloudFront: Global distribution, DDoS protection
Processing & Services
EKS: Managed Kubernetes for microservices
Lambda: Serverless event processors for simple transformations
Step Functions: Workflow orchestration for complex multi-step processes
SQS + SNS: Message queuing and fan-out patterns
ML at Scale
SageMaker:
Training Jobs: Distributed training on GPU clusters
Endpoints: Auto-scaling model serving
Feature Store: Managed online/offline feature storage
ElastiCache + DynamoDB: Low-latency feature serving
AWS Bedrock: Optional LLM integration for natural language diagnostics
Data Platform
Aurora PostgreSQL: Serverless, auto-scaling transactional DB
Timestream: Purpose-built time-series database
S3 Data Lake: Raw events, processed data, ML artifacts
Redshift: Data warehouse for analytics and BI
Glue / Apache Airflow: ETL pipeline orchestration
Operations
CloudWatch: Metrics, logs, alarms, dashboards
X-Ray: Distributed tracing across services
Secrets Manager: API keys, database credentials
IAM + Cognito: Authentication and authorization
VPC + Security Groups: Network isolation and security
Production Scale Characteristics
MetricTargetStrategyThroughput100K+ events/secKinesis with auto-shardingLatencyp99 <100msElastiCache + read replicasAvailability99.9% SLAMulti-AZ, auto-failoverScale1M+ devicesHorizontal scaling, shardingData RetentionHot: 30d, Warm: 1y, Cold: 7yS3 lifecycle policiesGeographyMulti-regionActive-active with Route53Estimated Costs at Scale
10,000 devices (early production):
EKS cluster: ~$150/month
RDS Aurora: ~$200/month
Kinesis: ~$100/month
S3 + data transfer: ~$50/month
Misc (CloudWatch, etc.): ~$50/month
Total: ~$550/month
100,000 devices (growth stage):
EKS + EC2 instances: ~$800/month
Aurora + read replicas: ~$600/month
Kinesis + shards: ~$500/month
S3 storage: ~$200/month
Data transfer: ~$300/month
Total: ~$2,400/month
1,000,000 devices (scale):
Infrastructure: ~$15K-25K/month
Requires cost optimization, reserved instances, and architectural refinements
Key Architecture Tradeoffs
1. Storage Engine Selection
ClickHouse vs TimescaleDB
ClickHouse (Chosen):
✅ 100x faster for analytical queries on time-series data
✅ Built-in compression (10:1 typical)
✅ Native aggregation functions (percentiles, moving averages)
✅ Scales to billions of rows easily
❌ Limited UPDATE/DELETE operations
❌ Eventual consistency (not strict ACID)
TimescaleDB (Alternative):
✅ Full SQL compatibility (familiar to most devs)
✅ Strong ACID guarantees
✅ Better for transactional workloads
❌ Slower at analytical scale
❌ More complex sharding/scaling
Decision: Use ClickHouse for time-series telemetry, PostgreSQL for transactional data. Best of both worlds.
2. Event Processing Pattern
Redis Streams vs Kinesis
Redis Streams (PoC):
✅ Simple setup, low latency
✅ Perfect for single-node or small clusters
✅ Built-in consumer groups
✅ Great for development
❌ Limited persistence (relies on snapshots)
❌ Harder to scale across regions
Kinesis (Production):
✅ Fully managed, auto-scaling
✅ 7-day retention (vs 1-day typical for Redis)
✅ Multi-region replication built-in
✅ Integrates with AWS ecosystem
❌ More expensive (~$0.015/million events)
❌ 1MB message size limit
Migration trigger: When throughput exceeds 10K events/sec or when multi-region is required.
3. ML Model Serving
FastAPI + PyTorch vs SageMaker
Custom FastAPI (PoC):
✅ Full control and flexibility
✅ Easy local development and testing
✅ Any framework (PyTorch, TensorFlow, scikit-learn)
✅ Deploy anywhere (K8s, Docker, Lambda)
❌ Manual scaling configuration
❌ You manage infrastructure, monitoring, rollbacks
SageMaker (Production):
✅ Managed infrastructure with auto-scaling
✅ Built-in A/B testing and canary deployments
✅ Model monitoring and drift detection
✅ Integration with AWS ML ecosystem
❌ Vendor lock-in
❌ Cold start latency for serverless endpoints
❌ More expensive
Hybrid approach: Start with FastAPI on EKS, migrate complex models to SageMaker as team bandwidth becomes constrained.
4. API Protocol
REST vs GraphQL vs gRPC
REST (Phase 1):
✅ Universal, simple, well-understood
✅ Easy caching with HTTP headers
✅ Great for CRUD operations
✅ Excellent tooling and debugging
❌ Over-fetching or under-fetching data
❌ Multiple round-trips for related data
GraphQL (Phase 2):
✅ Single query for exact data needed
✅ Strong typing with introspection
✅ Excellent for complex mobile apps
❌ Caching is more complex
❌ N+1 query problem (without DataLoader)
gRPC (Optional):
✅ Very low latency, efficient binary protocol
✅ Bi-directional streaming
✅ Great for service-to-service communication
❌ Not browser-friendly (needs grpc-web)
❌ Steeper learning curve
Decision: REST for PoC and external APIs. Add GraphQL for complex client queries. Use gRPC for internal microservices if latency is critical (<10ms).
5. Orchestration Platform
K3s vs EKS vs ECS
K3s (PoC):
✅ Lightweight, starts in seconds
✅ Perfect for local development
✅ Full Kubernetes API compatibility
✅ Runs on M1 Mac without issues
❌ Single-node by default
❌ Not recommended for production
EKS (Production):
✅ Managed Kubernetes control plane
✅ Native AWS integrations (IAM, VPC, EBS)
✅ Industry-standard, portable
✅ Rich ecosystem (Helm, operators, etc.)
❌ More expensive than self-managed
❌ Requires coordination for upgrades
ECS (Alternative):
✅ Simpler than Kubernetes
✅ Tighter AWS integration
✅ Lower learning curve
❌ AWS-specific (vendor lock-in)
❌ Smaller ecosystem
Decision: K3s locally, EKS in production. The investment in Kubernetes expertise pays off with portability and ecosystem.
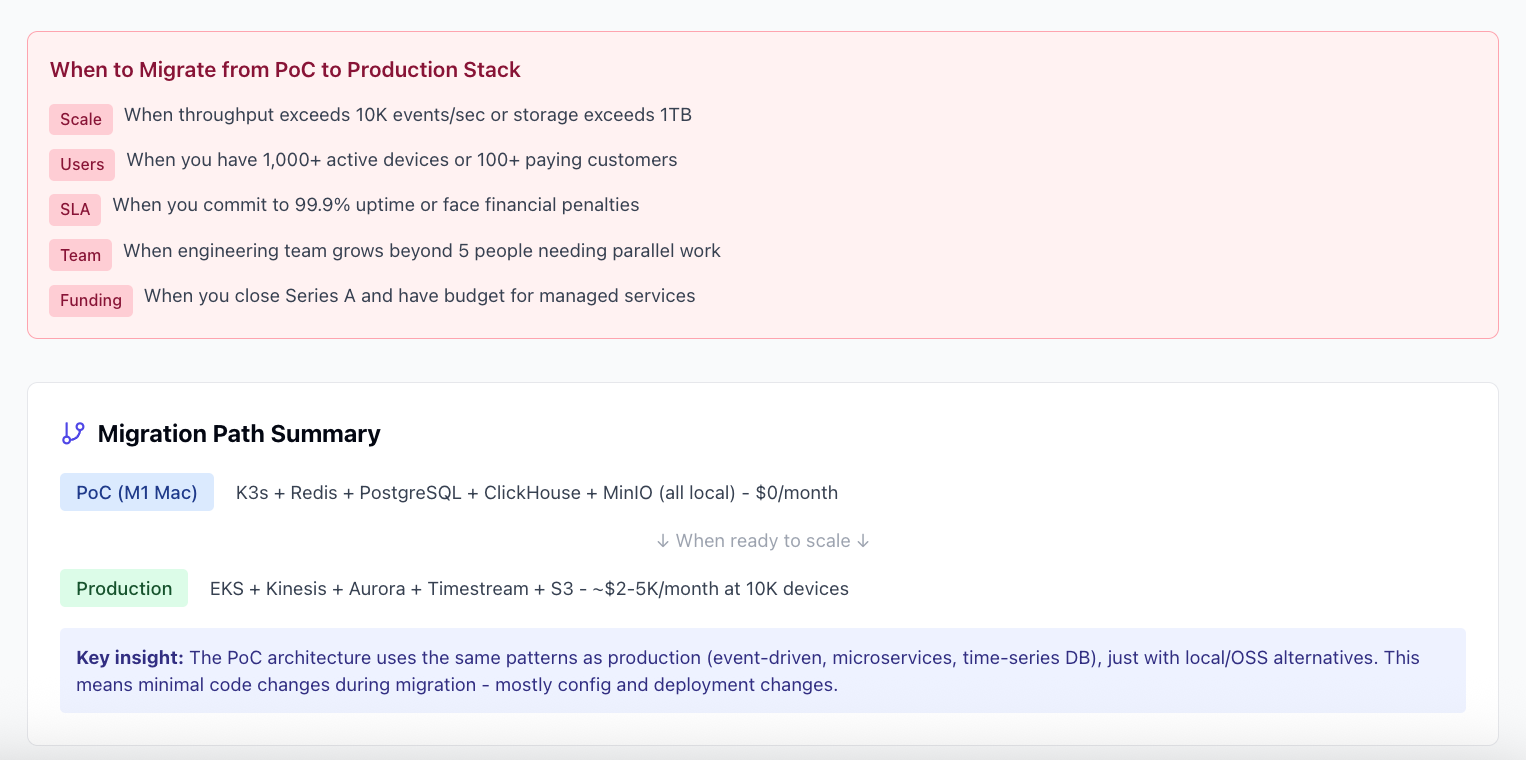
When to Migrate from PoC to Production
Don’t migrate too early or too late. Here are clear triggers:
Technical Triggers
⚡ Throughput: Exceeding 10K events/sec consistently
💾 Storage: Approaching 1TB of data
🌍 Geography: Need multi-region for latency or compliance
🔒 Security: Enterprise customers require SOC2/HIPAA compliance
Business Triggers
📈 Scale: 1,000+ active devices or 100+ paying customers
💰 SLA: Committed to 99.9% uptime with financial penalties
👥 Team: Engineering team grows beyond 5 people
🏦 Funding: Closed Series A with budget for managed services
Red Flags (Don’t Migrate Yet)
❌ Still iterating on core product features
❌ No paying customers yet
❌ Team of 1-2 engineers (focus on product, not infrastructure)
❌ Can’t articulate why you need production infrastructure
Example: Key Data Entities
Device Telemetry Event
json
{
  “deviceId”: “thermostat_abc123”,
  “timestamp”: “2024-12-04T10:30:00Z”,
  “measurements”: {
    “tempIndoor”: 72.5,
    “tempOutdoor”: 85.2,
    “humidity”: 45,
    “pressure”: 1013.25,
    “hvacState”: “cooling”,
    “dutyCycle”: 0.65,
    “powerConsumption”: 3.2
  },
  “metadata”: {
    “firmwareVersion”: “2.1.3”,
    “signalStrength”: -45
  }
}
Diagnostic Event (ML Output)
json
{
  “deviceId”: “thermostat_abc123”,
  “timestamp”: “2024-12-04T10:30:05Z”,
  “inference”: {
    “anomalyScore”: 0.89,
    “predictedIssue”: “refrigerant_leak”,
    “confidence”: 0.87,
    “severity”: “high”
  },
  “recommendations”: [
    {
      “action”: “schedule_maintenance”,
      “priority”: “urgent”,
      “estimatedCost”: 350
    }
  ]
}
Feature Vector (for ML)
json
{
  “deviceId”: “thermostat_abc123”,
  “timestamp”: “2024-12-04T10:30:00Z”,
  “features”: {
    “rolling_avg_24h_temp”: 71.2,
    “duty_cycle_trend_7d”: 0.03,
    “efficiency_score”: 0.82,
    “seasonal_baseline_deviation”: -0.15,
    “runtime_hours_30d”: 450.5
  }
}
Getting Started: Your First Week
Day 1-2: Local Infrastructure Setup
bash
# Install prerequisites
brew install k3d terraform docker-compose

# Create K3s cluster
k3d cluster create smartac-dev --agents 2

# Deploy storage layer
docker-compose up -d postgres clickhouse redis minio

# Verify
kubectl get nodes
docker ps
Day 3-4: Build Core Services
Implement REST API gateway (Express.js or Go Fiber)
Set up Redis Streams producer/consumer
Create device simulator (Python)
Build simple event processor
Day 5-6: Add ML Layer
Train basic anomaly detection model (scikit-learn)
Build FastAPI inference service
Integrate with event processor
Set up feature engineering pipeline
Day 7: Observability
Deploy HyperDX
Add logging, tracing, metrics
Create first dashboard
Test end-to-end flow
Comparable Real-World Systems
1. Nest / Google Home
Scale: Millions of connected thermostats
Similar challenges: Real-time anomaly detection, energy optimization, predictive maintenance
Architecture: Event-driven, microservices on GCP
2. Tesla Fleet Telemetry
Scale: Millions of vehicles streaming data
Similar challenges: ML-driven diagnostics, OTA updates, predictive maintenance
Architecture: Event-driven with both real-time and batch processing
3. Samsara (Connected Operations)
Domain: Fleet, equipment, facilities monitoring
Similar challenges: Multi-tenant SaaS, real-time dashboards, AI-powered insights
Architecture: Event-driven backend, time-series analytics
4. Uptake (Industrial AI)
Domain: Predictive maintenance for heavy equipment
Similar workflow: Sensor data → feature engineering → ML inference → actionable insights
Proven: 0 → enterprise scale trajectory
Conclusion: Key Takeaways
✅ Do This
Start simple: PoC with open-source tools on your laptop
Use the same patterns: Event-driven, microservices from day 1
Plan for scale: Architecture should support 100x growth
Measure everything: Observability is not optional
Document tradeoffs: Write down why you made each decision
❌ Avoid This
Over-engineering: Don’t start with EKS if K3s works
Premature optimization: Profile before optimizing
Technology hype: Choose boring, proven tech
Ignoring costs: Track infrastructure spend from day 1
Solo hero mode: Document everything, make it reviewable
🎯 Success Metrics
PoC Phase (Month 1-3):
Deploy locally in <1 day
Simulate 1,000 devices
End-to-end latency <1 second
Working ML inference
Cost: $0
MVP Phase (Month 4-6):
10-100 real devices connected
First paying customer
99% uptime (informal)
Basic observability
Cost: <$200/month
Growth Phase (Month 7-12):
1,000+ devices
Multiple customer segments
99.9% SLA
On-call rotation
Cost: <$2K/month
Further Reading
Designing Data-Intensive Applications by Martin Kleppmann
Building Microservices by Sam Newman
Have questions or want to discuss architecture tradeoffs? Leave a comment below or reach out on [Twitter/LinkedIn].
Special thanks to the SmartAC team for the inspiring job description that sparked this architecture exploration.